Our carbon emissions
The Greenhouse Gas Inventory (GHGI) reports provide an assessment of the greenhouse gas emissions the University is accountable for.
The assessment is based on the best available data and includes indirect contributions along the supply chain as well as carbon credits and renewable GreenPower purchases.
As one of the priority actions in the Sustainability Plan, the GHGI assessments summarise the University’s greenhouse gas emissions, including a breakdown by activity sector.
2023
Overall, the University's gross carbon emissions for 2023 were 241,128 tonnes of carbon dioxide equivalent (tCO2-e).
2019
The 2019 GreenHouse Gas Inventory was produced by consultants Pangolin Associates.
2018
The 2018 update for the University's Greenhouse Gas Inventory is represented in the chart below through a comparison by activity sector of emissions for 2016, 2017 and 2018.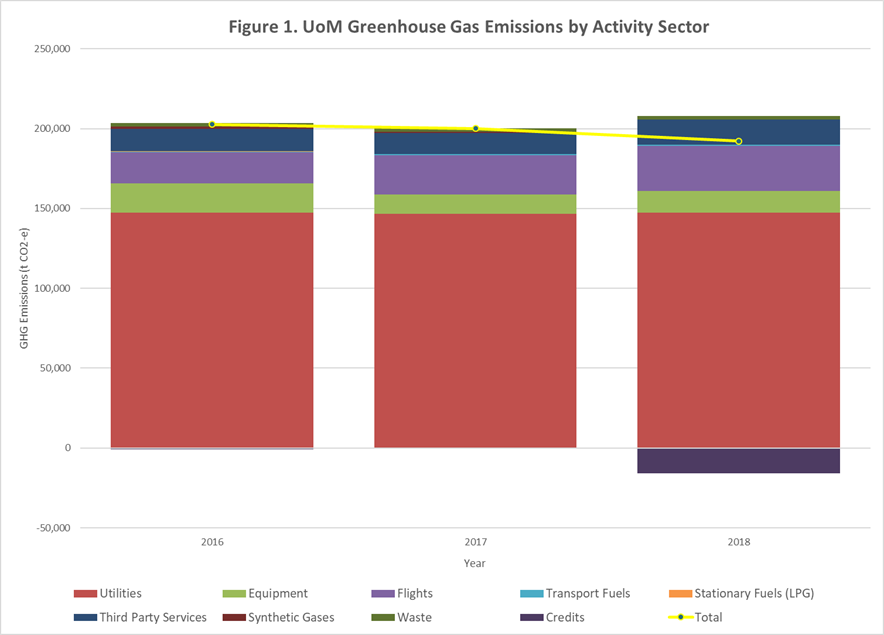
2017
The University released a summary Greenhouse Gas Inventory for the 2017 calendar year. Based on the available data, the University emitted a gross total of 200,050 tonnes of carbon dioxide equivalent (tCO2-e) in 2017. This is a small reduction on the 2016 gross total emissions of 203,421 tCO2-e. Indirect emissions along the supply chain (scope 3 emissions) have been included where possible.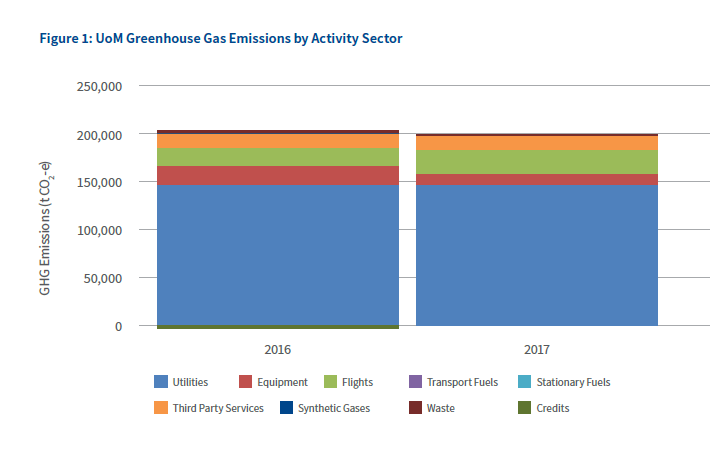
The biggest contributor to total emissions was electricity consumption, as part of the utilities category. As such, the University's undertaking to achieve zero net emissions from electricity by 2021 will immensely improve the University's environmental impact.
2016
The University’s first comprehensive Greenhouse Gas Inventory was completed by consultants from Pangolin Associates. The GHGI assessment summarises the University's greenhouse gas emissions for the calendar year 2016, including a breakdown by activity sector (see below).
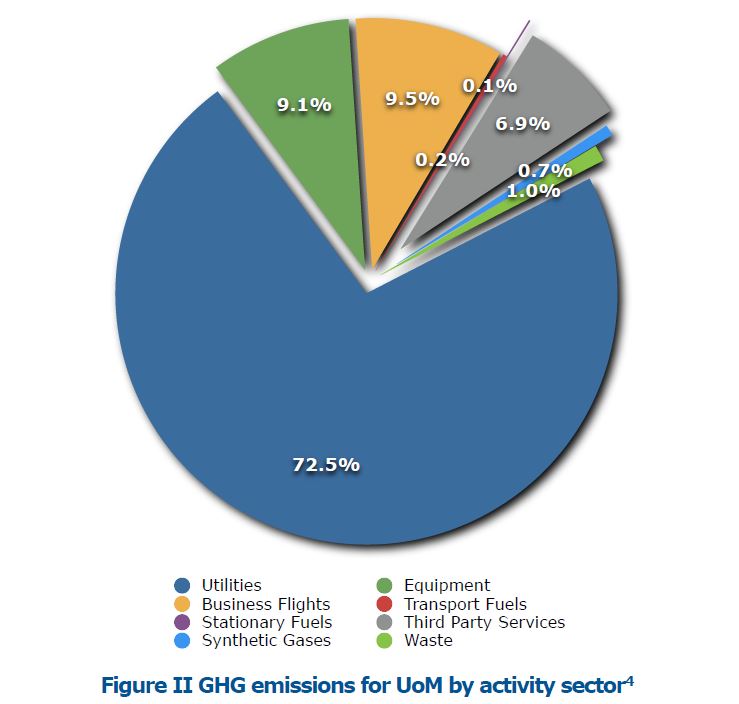
Based on the available data the consultants from Pangolin Associates concluded that the University emitted a net total of 202,656.8 tonnes of carbon dioxide equivalent last year. The biggest contributor to these emissions was electricity consumption, as part of the utilities category.
2016 Gold Star sustainability rating
In November 2017, the University was awarded a Gold Sustainability Rating by Pangolin Associates for its efforts in 2016 to reduce carbon emissions, energy usage and to recognise its commitment to achieving environmental sustainability. This inaugural report provides a solid basis for the University to progress its commitment to achieve carbon neutrality before 2030, and zero net emissions from electricity by 2021.

4 Due to data constraints, air travel data is incomplete and emissions from the source are only related to flights booked through Campus Travel. As a result, business flight GHG emissions are expected to represent a significantly higher proportion of the total shown in Figure II. See Section 2.3 of this report for more details.